Science Through Backyard Astronomy

With so many of us home or not venturing far from home in these COVID-19 times, it’s a great time to do some local backyard astronomy. And you can contribute to valuable citizen science efforts by submitting your observations to GLOBE at Night. This year’s campaign extends through the entire calendar year, so take advantage of any clear skies, do some observing, and be included in this study of light pollution worldwide!

As of July 2020, citizen scientists from around the world have contributed 20,442 night sky observations to help quantify light pollution around the world. Participating is simple: go outside about one hour after sunset and locate the constellation(s) identified for that month.

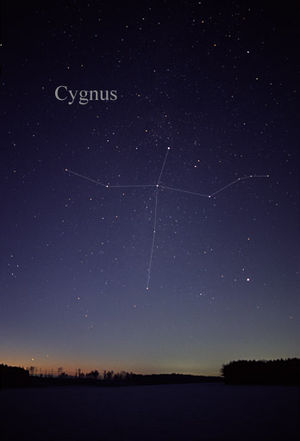
August: Cygnus, Hercules
September: Cygnus
October: Cygnus, Pegasus
November: Pegasus, Perseus
December: Perseus

(For star-hunting tips as well as Southern Hemisphere constellations, view the GLOBE at Night website.)

View of Cygnus the Swan in the northern sky, Creative Commons image from Till Credner.

Once you’ve found the constellation in the sky, compare your observation with a brightness magnitude chart, and report your finding along with your latitude and longitude on the website. You can look at the GLOBE at Night results to see how the light pollution of your skies compares with that in other locations around the world.

This year’s observing period continues through December, so visit the website to learn more, get out there and marvel at the stars, and submit your observation to be counted and contribute to learning more about light pollution, both locally and globally.

Sunrise, Sunset, and Moving Swiftly Through the Days

A new month in a new year and it’s gone by far too quickly. I thought I’d close out the lengthening days of January by sharing some interesting sources of information. The pick for today is the NOAA Sunrise/Sunset Calculator, developed by some talented former colleagues. It is a resource used by people in all walks of life—from scientists and sky watchers to film makers and event planners—and a great way to explore what’s going on in terms of the number of hours of daylight received in a day.

According to the calculator, at 40 degrees latitude in the approximate middle of the mountain time zone, the apparent sunrise on January 31 is 7:09 a.m. and apparent sunset is 5:19 p.m. What’s “apparent” sunrise, you ask? Let’s use this graphic from the solar calculator Help Guide (really guys, great work putting this resource together!) to illustrate:

schematic showing reflection of visible light by atmosphere
Gases in Earth\’s atmosphere refract visible light from the Sun.

Earth’s atmosphere refracts (or bends) incoming light from the Sun. Because of that refraction, we see the sun “rise” shortly before it actually crosses the horizon. Likewise, we see the setting sun for a short time after the sun has actually “sunk” below the horizon at the end of a day. (If this part sounds like desperation from a person eager for any at all additional daylight, well, consider that mid-latitude winters sometimes just seem…long.) Apparent sunrise and sunset times are different than actual sunrise and sunset times, adding just that little bit of additional time to the number of hours of daylight in a day.

The nice thing about the end of January sunrise and sunset times is how they differ from the dark, dark days of December. Did we talk about the solstice on December 21? On that day, the apparent sunrise was at 7:18 a.m. but the sun was gone a full 40 minutes earlier, at 4:39 p.m. For those of us desperate enough to grab those few minutes based on apparent sunrise and sunset, 40 minutes seems quite a cause for celebration, or at least acknowledgment. Go ahead, play with sunrise and sunset times for your location, and check out what happens at the summer solstice too.

Fun with Snow

snowflake stamps from the United States Postal Service
The United States Postal Service released these snowflake stamps in October 2006.

Do you remember the year the United States Postal Service offered stamps with photos of lovely snowflakes? Those were by far my favorite holiday stamps to date, and one of the things I liked best was that USPS included some information about the images. For example, the stamps show three stellar dendrites and a sectored plate, each having its own unique characteristics, like every single snowflake out there. Nature. Is. Cool. You can view the original images, and learn more about the uniqueness of snowflakes and how to identify snowflake types, at this site by Cal Tech’s Kenneth Libbrecht, who photographed the snowflakes.

With the Northern Hemisphere winter solstice occurring in less than a week, I thought it would be a good time to pass along some experiments to let you have fun with snow. Check out this article by NCAR scientist Peggy LeMone and this one also. Ideas for a science fair project, perhaps?

And if you’re in the U.S. and want to report your snow (and other precipitation) measurements, check out the Community Collaborative Rain, Snow, and Hail Network (CoCoRAHS) —it’s a great citizen science opportunity.

Plant Phenophases and Citizen Science

aspens color the hillside during the Colorado autumn
Golden aspens color the hillside during autumn in Colorado. Photo ©sciencespeak.org

It’s one day after the autumnal equinox and rather chilly here along the Rocky Mountain Front Range. The aspens in the mountains are a blaze of yellow, and the other day I saw the first leaves turning color down at this elevation. We see these yellow, orange, and red colors in the fall leaves as trees shut down in preparation for winter. The shorter daylengths cause trees to stop producing chlorophyll, so that anthocyanins (red pigments) and carotenoids (yellow and orange pigments) become visible.

Changes in leaf color are an example of a phenological change. Phenology is the study of the timing of life cycle events in plants and animals—budburst, flowering, animal migration, and other events. Farmers have long been aware of how phenological observations relate to agricultural production, but more recently the observations have found increasing use in science, particularly for tracking the effects of climate variability and change.

Phenological observations provide a great opportunity for citizen science. Citizen science projects allow anyone willing to do some observing to report their findings and contribute to scientific analysis and research. One of my goals is to share these opportunities with you, when possible, and Project Budburst is a great one. It’s simple to participate: take a look around, and if you have kids, encourage them to look with you. Watch for seeds ripening, leaf color change, leaf drop, and other phenological events documented on the website, and login and report your observations. This important citizen science project has a goal of recording 5,000 phenophase observations this fall. You can help them get there, and do some learning and sharing about science all while enjoying the spectacular fall colors!